Developers & Practitioners
Go from Database to Dashboard with BigQuery and Looker
April 29, 2021
Leigha Jarett
Developer Advocate, Looker at Google Cloud
Creating an effective and scalable dashboard can be a time consuming process. But with Looker, analysts are no longer stuck re-writing tedious SQL queries. In our upcoming webinar, we’ll show you how to go from tables in BigQuery to a real-time, operational dashboard in Looker, in less than 30 minutes.
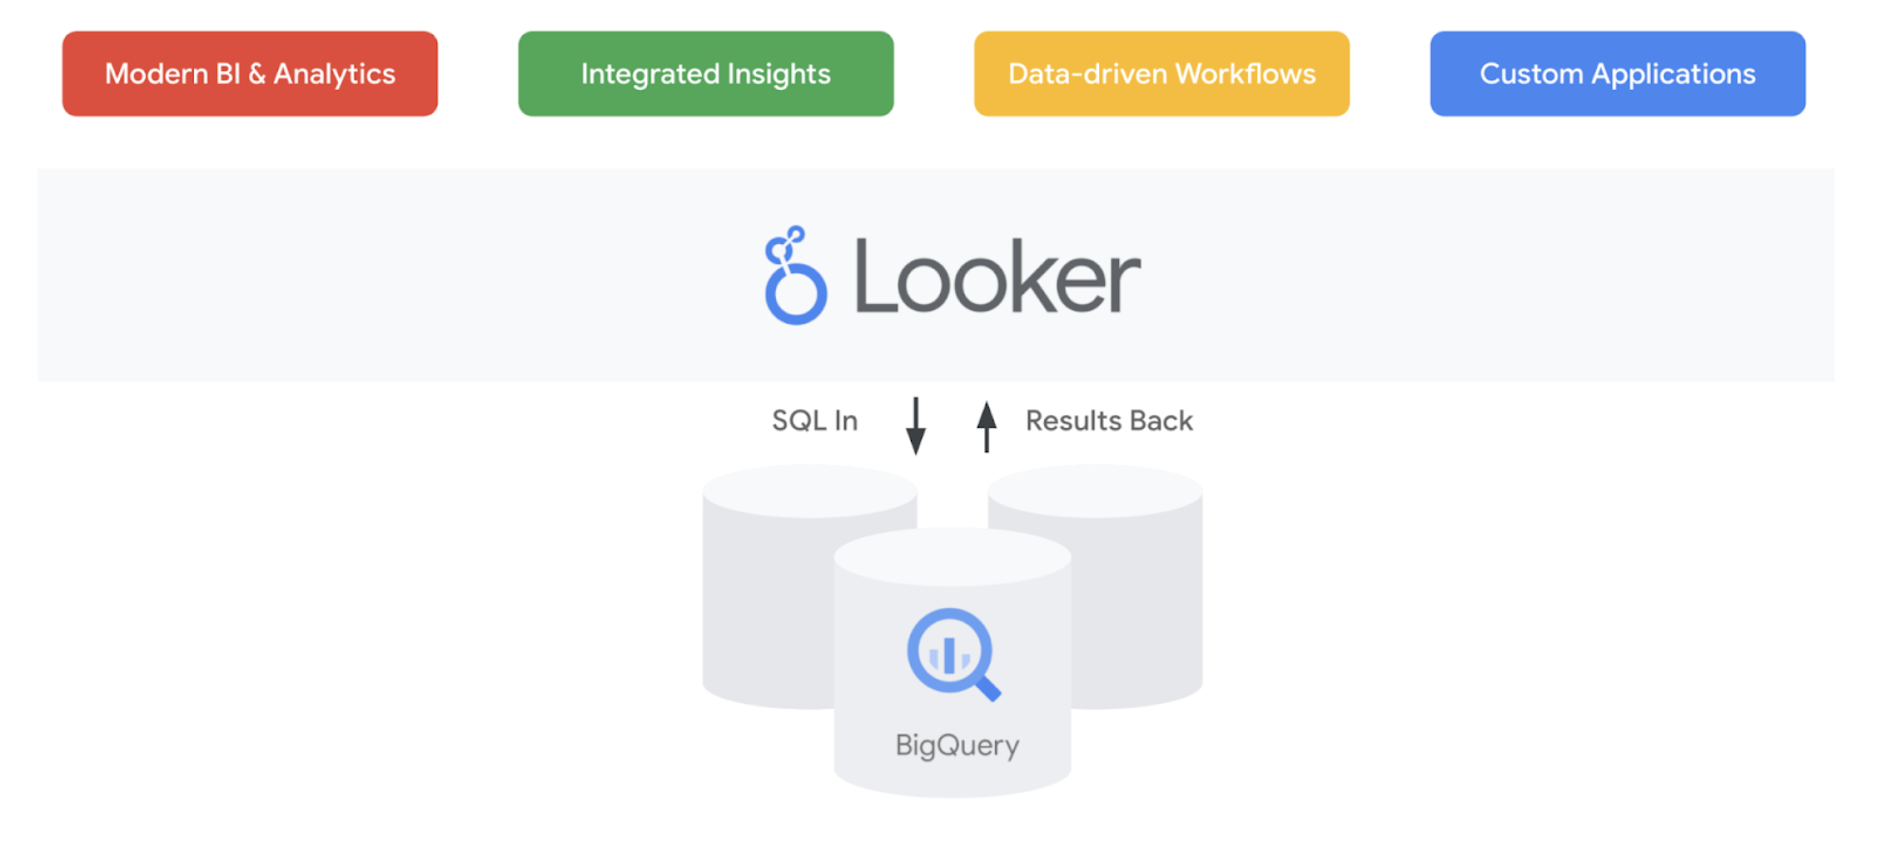
Why use Looker + BigQuery?
BigQuery is Google Cloud’s fully managed enterprise data warehouse. BigQuery has a slew of features that make it a powerful tool for creating meaningful analyses:
- Support for nested records, partitioning, clustering and an in-memory execution engine make it simple to store and query huge amounts of data
- Built in machine learning (BQML) opens up endless possibilities to create powerful AI workflows
- Robust integrations with the Google ecosystem allow for easy data ingestion, including streaming inserts in real-time
Ready to learn more? In the webinar, we’ll cover how to:
- Connect your BigQuery project to Looker
- Automatically generate a new data model based on your table schemas
- Create custom calculations that leverage key BigQuery functions
- Explore your findings and uncover actionable insights